INTRODUCTION
Microspheres are tiny spherical particles of micrometer diameter range (usually between 1 µm and 1000 µm). Often, microspheres are called microparticles. Microspheres can be obtained from different natural and synthetic materials. Commercially available are ceramic microspheres, polymer microspheres and glass microspheres. Microspheres with solid and hollow densities vary drastically and, therefore, are used in various usages. Hollow microspheres are normally used as antioxidants to reduce material density.
Recent advances have resulted in the development of various types of microspheres (such as floating, mucoadhesive, radio-active, double-walled, and magnetic) to serve different purposes. For example; floating/mucoadhesive microspheres have been developed as gastroretentive delivery systems.1
MATERIALS AND METHODS
Materials
Gabapentin was obtained as a gift sample from Alkem Laboratories (Mumbai, India). The other excipients used were of analytical grade.
Preparation of microspheres
The solvent evaporation technique was employed to prepare gabapentin-loaded floating microspheres. HPMC K100 and cellulose acetate phthalate were dissolved in various ratios at room temperature in a blend of ethanol and dichloromethane. Gabapentin was added to the above solution and was agitated to create a homogeneous solution on a magnetic stirrer. The above solution containing gabapentin was squeezed into 100 mL of water containing 0.01% tween 80 at room temperature and stirred for three hours. Finally, microspheres were filtered, separated and dried at room temperature. The formulation composition is provided in Tables 1 and 2.
Characterization of floating gastroretentive microspheres
Micromeritic evaluation
Bulk density: Bulk density= Bulk/mass volume
Tapped density: Tapped density= Tapped/mass volume
Carr’s (compressibility) index:
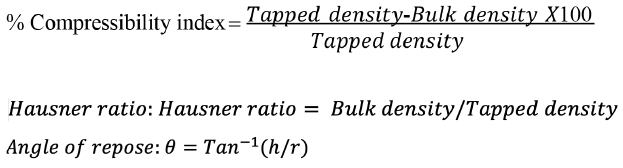
Where h= pile height, r= pile radius, and θ= angle of repose
Particle size
The size of a particles of the blank and gabapentin-loaded microsphere was determined by optical microscopy method using a compound microscope (Olympus India) equipped with ocular and calibrated stage micrometers. After the calibration of an ocular micrometer by placing the ocularlens and following focusing on the object to be measured and determining the size in ocular units, then placing the samples on a slide and measuring the size of microspheres.2,3,4

Percentage yield
The percentage yield of microspheres is ratio the of the weight of microspheres collected or recovered to the total weight of all solid contents taken. Dry microspheres collected were weighed to assess recovery:#
*#ref5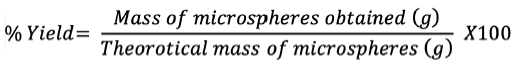
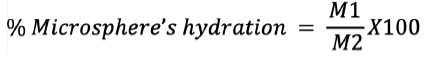
Measurement of microspheres hydration
Hydration of the microspheres is described as the ratio of wet microspheres to dry microsphere’s weight. The recovered microspheres were immediately weighed and depicted at the end of each microencapsulation phase (M1). When the microsphere is dry to a constant weight, it is again measured and shown as an (M2). It is expressed by the following equation:6
Determination of drug loading of microspheres
20 mg of hollow-loaded gabapentin microsphere samples were dissolved at room temperature by ultrasonication in 50 mL ethanol to determine to load. The liquid was then purified by a millipore (0.45 µm) filter. Ultraviolet (UV)-visible sensor (UV 1700-1800) (Shanghai Phoenix Optical Instrument Co., Ltd., Shanghai, China) was used to determine drug concentrations at 210 nm and 284 nm. The drug loading of gabapentin-loaded hollow microspheres was determined by the following equation.7

Drug entrapment efficiency
The entrapment efficiency of the microspheres was determined by extraction of drug from the microspheres. In a typical procedure, 50 mg of dried microspheres was ground in a pestle and mortar, and the fine microspheres dissolved in a few mL of ethanol and diluted with 50 mL of 0.1 N HCl for 24 h. After 24 h, the solution was moved over a 0.45 µm filter. The gabapentin present in the filtrate was evaluated spectrophotometrically at 210 nm using a UV-visible spectrophotometer (Shimadzu, UV-1800, Japan) using 0.1 N HCl as blank.
8,9
Swelling measurement
The dissolution apparatus United State Pharmacopoeia (USP) type II, was used for the swelling analysis. The vessels that comprise simulated gastric fluid (SGF) were correctly weighed with gabapentin microsphere and allow to swell. The speed of rotation was adjusted at 50 rpm. The microspheres were removed and blocked-in filter paper at a pre-determined period to eliminate the excess water. The weight increases were calculated at various times before the full weight was increased. The index swelling was determined by the following equation:10
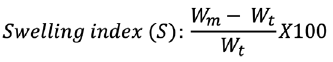
where Wm signifies the weight at equilibrium and Wt signifies the initial microsphere’s weight.
In vitro buoyancy
Gabapentin-equipped microspheres were assessed for in vitro floating properties on a USP dissolution device 2 (paddle type). Fifty single microspheres were submerged in a vessel of 500 mL SGF from each formulation. The rotation of the paddle at 50 rpm, while maintaining the temperature at 37 ± 0.5°C. The number of microspheres floating was measured up to eight hours at hourly periods. In vitro buoyancy was represented as a percentage and the following equation was determined:11
In vitro drug release
Dose equivalent to 100 mg of floating microspheres of gabapentin was accurately weighed and dissolution studies were conducted using SGF (enzyme-free) (900 mL) at temperature 37 ± 0.5°C using USP type II apparatus. The rotation speed was maintained at 100 rpm. An aliquots of 5 mL of dissolution medium was removed at a fixed intervals until a period of 12 h and substituted with a fresh medium. The content of gabapentin microspheres was determined using a UV spectrophotometer (Spectro UV-2080, double beam, Analytical Technologies, India) at 210 nm against SGF as blank.12
Scanning electron microscopy (SEM)
Dry gabapentin microspheres were mounted on a gold-coated electron microscope in an ion sputter. The random scan of a stub took a view of the microsphere. The microspheres study was conducted using JEOL, JSM-670F Japan. At an accelerated voltage of 3.0, the microspheres were presented.13
Drug release kinetics
The drug release from various controlled-release preparations is more often measured using four kinetic models. The data obtained from in vitro release of the drug were measured using 5 models to identify the most suitable model. The release of zero-order kinetics is a drug-release mechanism that is not based on drug concentration. The zero-order release equation is:6
Zero-order kinetics: Ft= K0t
Here, F indicates the drug fraction released in time t and K0 denotes the zero-order release constant.
First-order kinetics: “Ln (1 - F) = -K1t”
Here F shows the drug release fraction in time t and K1denotes the Ist order release constant
Higuchi model: F= K2 t1/2
Here F signifies drug release fraction in period t &K2 denotes the “Higuchi constant”.
Korsmeyer-Peppas model: Mt/M∞= K3tn
Here Mt denotes the drug amount released in time t, M∞ signifies the drug amount release at time infinity, K3 denotes the kinetic constant and n indicates the exponent defining the swelling mechanism.
Stability study14
The optimized formulation was kept for accelerated stability study according to the International Conference on Harmonization (ICH) guidelines for 3 months. Microspheres were packed in a laminated aluminum foil and kept in a stability chamber maintained at a temperature of 40 ± 2°C and 75.5% relative humidity. At the end of 0, 30, 60, 90 days, samples were withdrawn and examined for percentage buoyancy drug, entrapment efficiency and in vitro drug release.
In vivo study15,16
The in vivo radiographic studies were conducted on young and healthy four male albino rabbits weighing 2.0 to 2.2 kg to monitor the in vivo transit behavior of the prepared floating hollow microspheres. The animals were fasted for 12 h before the start of the experiment. The absence of radioopaque material in the gastro intestinal tract was confirmed by taking the first radiographic image of the animal. The optimized formulations, which showed good in vitro buoyancy and sustained-release behavior were selected for the study. The optimized formulation i.e. FFMG6 batch was administered to rabbits.
RESULTS AND DISCUSSION
Micromeritic evaluation of gabapentin microspheres
The designed formulations possessed an average particulate size between 198.55 ± 0.28 and 469.3 ± 0.09 µm. Ci values range from 2.62 ± 0.61 and 19.81 ± 0.93 that indicate poor to excellent microspheres flow. All the formulations exhibited Hr values below 1.25 that indicate good flow characteristics. Besides, angle of repose value less than 25 indicates good flow properties.
Evaluation of preliminary batches of gabapentin microspheres
The percentage yield was 54.5 ± 0.92 to 91.18 ± 0.24 and in vitro buoyancy 68.89 ± 0.44 to 92.41 ± 0.21 for preliminary batches prepared. Drug loading in all formulation batches was good and ranged from 7.778 ± 0.39 to 10.03 ± 0.05. The swelling study revealed the swelling properties of the polymers used and the swelling index was found between 675.0 ± 2.37 to 856.3 ± 0.19. The results are demonstrated in Table 3.
In vitro drug release
The SGF (pH 1.2) was used for in vitro drug release experiments. The drug release for batch FMG3 was highest among the preliminary batches 98.64%. The result is shown in Figure 1.
Evaluation of gabapentin microspheres factorial batches
Micromeritic evaluation of gabapentin factorial batches
The average particle size of the floating microsphere formulations (FFMG1-FFMG9) ranged from 185.63 ± 0.13 to 510.04 ± 0.09 µm. Formulations representing an increase in cellulose acetate phthalate and HPMC k15 concentrations demonstrated a rise in the size of the particle. This can be attributed to increased relative viscosity of cellulose acetate phthalate and HPMC k15, which takes great energy to cut droplets and is harder to spread by enhancing interfacial tension and reducing shearing ability, contributing to the formation of major droplets of floating microspheres when polymer solution is added. The bulk and tapped formulation densities were observed between 0.410 ± 0.11 to 0.875 ± 0.12 and 0.463 ± 0.14 to 0.91 ± 0.16, respectively. The Carr’s index indicates how microsphere bridges are formed. The values of all formulations ranged from 0.25 ± 0.06 to 12.15 ± 0.28, which showed excellent microsphere flow and compression, except formulation FFMG7, which shows 35.21 ± 0.15. The Hausner ratio for the cohesion of microspheres particles was calculated. All formulations had values below 1.54, which indicates strong flow characteristics with simple handling during processing. The angle of repose values of formulations was below 21, suggesting microspheres free-flow characteristics. The stronger microspheres flow means that the development of floating microspheres was non-aggregated. The improved flow can be attributed to changes in the particle shape and size of the prepared microspheres, resulting in reduced friction.
Evaluation of designed floating microspheres batches
To assess the polymer impact on the formulations, percentage yield of the floating microsphere was studied. The result indicates that the FFMG1 to FFMG9 percentage yields, as shown in Table 4, vary from 53.5 ± 0.95 to 96.64 ± 0.42. The rise in the polymer concentration contributed to an increase in percentage yield. This impact could be clarified by the fact that with the increasing concentration of alginate, the quantity of polymer is sufficient for gabapentin particles.
Drug trapping was linked to the permeation features of used polymers that would simplify the dissemination of a section of a medium stuck in floating microsphere preparation. With the polymer concentration, drug entrapment effectiveness improved. Table 4 presents the results. This is because the content of polymer has increased and more gabapentin particles are covered such that the encapsulation performance is improved.
The buoyancy percentage was studied and all formulations were observed to float for 12 h on the dissolution medium (0.1 N HCl, pH 1.2). The microspheres buoyancy percentage was observed to decline with a rise in cellulose acetate phthalate concentration (Table 4). This is due to the high viscosity of the polymer solution, which in turn leads to more dense microspheres and fewer pores besides cavities during preparation.
The drug loading in gabapentin microspheres was found to be 8.324 ± 0.23 to 11.843 ± 0.44. The swelling index was 756.34 ± 1.48 to 890.46 ± 0.78 indicating more swelling and hydration of microspheres. Besides, gastric residence time was also increased to a greater extent.
In vitro drug release for gabapentin factorial batches
The drug release was studied in SGF. The batch FFMG6 containing 0.5:0.75 polymer concentration exhibited maximum drug release (99.1%) relative to other batches. This indicates that batch FFMG6 contained the optimum concentration of polymer required for desired drug release. The drug release profiles of the designed batches are presented in Figure 2.
Scanning electron microscopy
The surface morphology of the microspheres was examined by SEM study. Figure 3 shows SEM images of microspheres taken in various magnifications. The SEM images showed the circular, isolated, and free-flowing microsphere. The surfaces were often slightly rough and drug crystals often existed on the microsphere surface. These drug crystals were liable for the explosion of the drug from the microspheres.
Drug release kinetics
To analysis, the gabapentin release mechanism in vitro, different release equations and kinetic models were fitted (zero order, first order, Korsmeyer-Peppas and Higuchi) for all selected batches. When the release profile was compared with the square root of time, a linear connection with the regression coefficient was observed nearly one. When n takes 0.5, it suggests diffusion-controlled release and indicates swelling-controlled release of medicines for value 1. A value of n within 0.5 to 1 represents the release mechanism by diffusion and swelling (anomalous transport). The optimized formulation FFMG6 shows an n value of 0.8474 and an R2 value of 0.9965. Hence, it can be concluded that the optimized formulation obeys the Korsmeyer-Peppas release kinetic model. The obtained results are demonstrated in Figure 4.
Statistical analysis and response surface study of factorial batches
The drug release and floating lag time were selected as dependent variables, and the effect of independent variables was studied on these responses. The ANOVA study showed that the selected independent variables HPMC K100 and cellulose acetate phthalate significantly affected the responses (p<0.05) (Table 5, Figure 5).
Final equations in the terms of actual factors
Drug release= +96.17222 + 2.18833 HPMC K100 + 2.21833 cellulose acetate phthalate- 1.83000 HPMC K100 *Cellulose acetate phthalate (Table 6).
Final equations in the terms of actual factors
Floating lag time= +63.01111 + 2.55500 HPMC K100 + 9.95167
Cellulose acetate phthalate -1.6150 HPMC K100 * cellulose acetate
Phthalate +12.08833 HPMC K100² + 3.58833 cellulose acetate phthalate² (Figure 6)
Stability study
The stability study was conducted as per ICH guidelines and indicated that developed microspheres were stable. This was evident from the unchanged properties of the microspheres after the duration of the study.
In vivo study
After oral dosing, it was obvious to the stomach clearly the hard gelatin capsules comprising BaSO4 loaded hollow floating microspheres. All microspheres were observed scattered inside the stomach in the radiographic image within an hour. Dense microsphere images were seen at first hours, but with time passing, the microsphere images became lighter. This may be due to the distribution and scattering in the GI area of the microsphere. The images showed that these floating hollow microspheres were successfully stored for up to 12 h in the stomach (Figure 7).
CONCLUSION
The floating microspheres of gabapentin were prepared and evaluated by 32 factorial design using HPMC K100 and cellulose acetate phthalate as polymers. The micromeritic study showed that the designed microsphere formulation displays better bulk and flow properties with optimum particle size. Moreover, FFMG6 batch was optimized based on the maximum drug release (99.1%). The developed microsphere formulations possessed optimum evaluation parameters, as evident from the study. The optimized formulation obeyed Korsmeyer-Peppas release kinetic model and SEM images showed spherical, discrete, and freely floating microspheres. Besides, floating hollow microspheres were successfully stored up to twelve hours in the stomach. The gastroretentive microspheres were stable under appropriate storage conditions. Therefore, the designed floating microspheres can be used for the delivery of the drugs like gabapentin.
Ethics
Ethics Committee Approval: The research article entitled “Development and evaluation of floating microspheres of anticonvulsant drug by 32 full factorial design” was carried out at IBSS College of Pharmacy, Malkapur (MS) India, and the has been approved by institutional ethical committee of this institute to carry out the experiment based on animals. Our CPCSEA establishment no: 1336/AC/10/CPCSEA.
Informed Consent: Not applicable.
Peer-review: Externally peer-reviewed.
Authorship Contributions
Surgical and Medical Practices: S.S., Concept: M.B., Design: M.B., Data Collection or Processing: M.B., K.S., S.J., N.B., Analysis or Interpretation: P.B., Literature Search: M.B., Writing: S.S., M.B.
Conflict of Interest: No conflict of interest was declared by the authors.
Financial Disclosure: The authors declared that this study received no financial support.