INTRODUCTION
Xanthohumol (XH) is a natural prenylated chalcone obtained from hops. It possesses potential pharmacological applications and is used against inflammation,1,2 cancer,3,4 diabetes,5 melanoma,6 hyperlipidemia,7 invasion,8 angiogenesis,9 and obesity.7,10 Due to these excellent therapeutic activities of XH, there is an immediate need to develop a simple, cost effective, rapid, sensitive, and accurate method to quantify XH in several matrices.4 As per our knowledge, there are no such ultraviolet (UV)-visible spectrophotometric methods available to quantify XH in bulk and in lipid-based nanocarriers. Therefore, in present research, analytical quality by design (AQbD) has been used to develop a novel simple and cost-effective method for the estimation of XH in bulk and in lipid-based nanocarriers. The structure of XH is represented in Figure 1.
Since the last decade, AQbD approach has gained great importance in method development and validation of various analytical methods. It is generally termed as a systematic approach for developing methods that starts with the already defined objectives and imparts special focus on understanding the process, product, and process control along with quality risk management (QRM).11 Analytical science is regarded as an important element in the development of pharmaceutical products and thus coincides with the product life cycle. The AQbD approach requires less time and decreases the number of trials of experimentation as compared to conventional types of analytical methods.12,13 It mainly employs the concept of design of experiments (DOE) and QRM to discover the likely risks as well as interactions associated amongst the method variables, therefore saving a significant amount of time effort and money. DOE is an integral part of AQbD because it provides the best possible method performance. It also permits construction of a statistically significant model that allows different factors and their interactive impact on responses to be estimated. Therefore, adopting principles of AQbD will provide a significant benefit in terms of complete understanding the performance of the method. Application of AQbD in the development of UV-visible spectrophotometric method has utmost priority than other conventional methods.14 Initially, before proceeding to method development, we have to select the analytical target profile (ATP) or the defined objectives of the study to be selected. Following that, risk assessment studies were used to identify the critical method variables (CMVs) and critical analytical attribute (CAA). CMVs impacting the performance of the method were optimized by central composite design (CCD) to ensure quality within the stated targets.15,16 The current research work is mainly based on the application of AQbD principles to decrease the variability occurring during measurement of XH to find the best solution. Therefore, a simple, robust, and economic UV-visible spectrophotometric method has been developed and validated as per the International Conference of Harmonization (ICH) guidelines Q2 (R1).17,18
MATERIALS AND METHODS
Experimental
Reagents and chemicals
XanthoFlav (XH) was gifted by Simon H. Steiner, Hopfen GmbH, Mainburg, Germany. Methanol of UV grade was purchased from Loba Chemicals, Mumbai, India. The solid lipid compritol E was gifted by Gattefosse Pvt. Ltd. (Mumbai, India). Lipoid E 80SN was gifted by Lipoid GmbH Germany. Pluronic F-68 was purchased from Loba Chemicals, India. Sephadex-G-25 was purchased from GE Healthcare, Hyderabad, India. All other chemicals used were of analytical grade.
Instrumentation
UV-visible spectrophotometer (1800, Shimadzu) with a set of 1 cm quartz cuvettes was used for the photometric analysis of the sample. Design Expert version 11 Statease software (Minneapolis, USA) is used for optimization. A 0.1 mg sensitive analytical digital balance was used for weighing all the components (Shimadzu).
Analytical method development and optimization
Defining analytical target profile and critical analytical attribute
ATP was established for the systematic development of XH estimation by outlining all of the required quality features of the analytical method using the principles of AQbD strategy. The method objective was defined based on the assessment of the literature and profile of the analyte. Motivation for selecting UV-visible spectrophotometric approach was due to its simplicity and speed of analysis compared to more advanced analytical methods. To satisfy ATP, XH absorbance is selected as CAA.15,19
Establishment of cause-effect relationship and risk management
Generation of CAA was made by studying the relationship between variables of the method and this CAA was used for analysis of control noise experiment (C-N-X). Ishikawa fishbone representation is used for depicting the correlation between CAA and method variables (Figure 2). C-N-X strategy used the risk assessment matrix to determine the crucial quality variables that are risky. Rankings were assigned to the recognized risky variables, and the overall score was used to determine the CMVs (Table 1). During the analysis of C-N-X, variables such as detecting wavelength, sampling interval, scanning speed, sample integrity, and solvent variation was investigated. Furthermore, the sampling interval and scanning speed were discovered as CMVs and treated with appropriate experimental design (CCD) for investigative evaluation and optimization.15,16,20
Determination of absorption maxima (λmax) for XH analysis
Absorption maxima of XH was determined by scanning solution of 10 mg/mL from 800 to 200 nm by taking methanol as blank. Absorption maxima spectrum of XH is represented in Figure 3. λmax of XH was identified as 369 nm and is used for further analysis.14
Optimization of the method by CCD
Identification of optimum conditions of the method and to assure robustness, CCD was used. Based on the risk assessment studies, optimization of the selected CMVs was performed by performing 13 experiments with five center points using CCD. The response variable (absorbance) of XH was evaluated by CCD and measured at 369 nm using 10 µg/mL standard solution. Design expert version 11 software (Stat Ease, Inc., Minneapolis, USA) is used to best fit the obtained data in to suitable mathematical model.15 Polynomial equations were created as per ANOVA for significant model terms with p values less than 0.05. A fit summary of the model for the selected CAA suggested a quadratic model as best fit. Correlation coefficient and lack of fit was used to evaluate the suitability of the model. The correlation between CAA and CMVs was investigated using contour plots and response surface plots. Furthermore, numerical and graphical optimization is used to improve the method conditions by software.
The design space created using DOE technique was used to define method control strategies within which minor changes in method performance were tolerated and considered resilient.
Selection of solvent
Solvent for the analysis was selected based on the solubility studies of XH in various solvents such as dimethyl sulfoxide (DMSO), methanol, chloroform, and water. XH has shown highest solubility in methanol and DMSO. Methanol has been selected as a solvent for spectrophotometric method development because DMSO produces toxicity and has stability issues.
Preparation of stock solutions
Primary stock solution was prepared by dissolving accurately weighed 100 mg of XH in 100 mL of methanol, which gives a solution of concentration 1 mg/mL or 1000 g/mL.
Secondary stock solution was prepared from primary stock solution by taking 10 mL of primary standard and volume is made with methanol up to 100 mL, which gives a solution of concentration 100 µg/mL. By using secondary stock, further dilutions were made for analysis.
Analytical method validation
A UV-visible spectrophotometer (Shimadzu, UV-6000) operated with spectral bandwidth of 1 nm was used for analytical method development and validation. Validation parameters including precision, linearity and range, accuracy, repeatability, specificity, limit of detection (LOD), limit of quantification (LOQ), and robustness were evaluated as per ICH guidelines Q2 (R1).18,21,22
Linearity
Six samples of diverse concentrations (2-12 µg/mL) were prepared from a secondary standard and used for executing the linearity parameter of XH in methanol. It was executed for three days in triplicate (n: 9). Linearity cures was plotted using the obtained data. Correlation coefficient equation and regression equation were determined using the same data.14,23
LOD and LOQ
Determination of LOD and LOQ for the method was performed by standard deviation (σ) and the slope of the standard curve.18 LOD and LOQ were given by the following equations:
LOD= 3.3*σ/S and LOQ= 10*σ/S
Where, σ is standard deviation and S is the slope of the standard curve.
Precision
UV method precision was determined in terms of variations in intraday and interday (intermediate day) precision. Levels of precision were examined for three diverse known concentrations (4, 6, and 8 µg/mL) of XH prepared from the secondary stock solution for intraday precision of XH three concentrations were determined by taking absorbance of the samples in triplicate three times in a day. Interday precision was executed by measuring the absorbance of selected samples for three days in triplicate. Using linearity curve %RSD was calculated for the samples.18,24
Repeatability
Determination of repeatability of the UV method was performed by measuring the absorbance of the XH solution in methanol six times at 4 g/mL concentration.18
Accuracy
Accuracy of UV method was estimated by a standard addition method. In this method, a standard stock solution of known amount was added to the test solution (6 µg/mL, prepared from secondary stock solution) of XH at various levels such as 80%, 100%, and 125%. Absorbance for the prepared solutions was determined and concentration was calculated again in triplicate using the linearity curve.15,18
Specificity
Specificity test was performed using blank solid lipid nanoparticles (SLNs) (only excipients). Blank SLNs were prepared and a known amount of XH was added to the dispersion. The resulting dispersion was mixed vigorously. 1 mL of sample was taken and subjected to nanoparticle lysis. XH extraction was made by using methanol up to 5 mL. The sample was analyzed by the developed method after filtering through a 0.22 µm filter.15,18
Analysis of in-house prepared SLNs of XH
Preparation of solid lipid nanoparticles
XH-loaded SLNs were prepared using homogenization-ultrasonication method. It mainly includes two steps as first the preparation of lipophilic phase and later preparation of aqueous phase. The lipophilic phase is prepared by melting solid lipid (compritol E ATO) 10 °C above its melting point. XH and lipophilic surfactant (lipoid E 80SN) were added to the molten lipid and stirred well. Aqueous phase was prepared by dissolving Pluronic F-68 in water. Both the aqueous and lipid phases heated to the same temperature, i.e., above the melting point of the lipid. Then, under hot conditions, the aqueous phase was added to the lipid phase dropwise with continuous stirring. The mixture was subjected to high shear homogenizer for 30 min at 6000 rpm followed by probe sonication at 40% amplitude and 35 pulse rate for 10 min. The resultant dispersion was cooled to room temperature for solidification and precipitation of SLNs.25
Analysis of solid lipid nanoparticles
The prepared SLNs were analyzed by the developed and validated method for determining percentage-entrapment efficiency (EE) and percentage drug loading (DL).
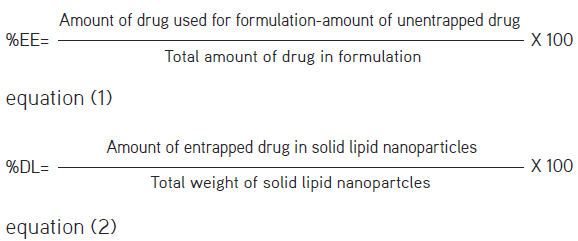
Entrapment efficiency (%) and drug loading (%)
EE (%) of XH-SLN was determined by separating the entrapped and unentrapped XH using Sephadex G-25 chromatography. The drug in XH-SLN was extracted after the lysis of lipid particles by mixing with methanol followed by filtration through a 0.22 µm filter. Then, both entrapped and unentrapped XH content was determined in triplicate using the above developed and validated UV method. Concentration of XH was calculated using the calibration curve.21,26
%EE and %DL were calculated using the following equation:
RESULTS
Analytical method development and optimization
Solubility of XH was found to be freely soluble in methanol and DMSO, based on the toxicity and stability parameters, and methanol was selected as the solvent for UV-visible spectrophotometric method development and validation. The developed and validated method was used for characterization (%EE and %DL) of prepared SLNs. The absorption maxima spectrum was determined using methanol and was found to be 369 nm (Figure 3). To obtain CMVs for developing final spectrophotometric conditions, AQbD approach was used. C-N-X approach was used to identify CMVs using the Ishikawa fishbone diagram and C-E risk assessment matrix. The risk levels of CMVs were identified based on the literature27 and ranked according to their severity. The parameters with higher severity were selected and optimized using CCD. Total scores for various method variables were calculated and prioritized for DOE investigation. The influence of CMVs on CAA was assessed by CCD. UV-visible spectrophotometer was used to conduct 13 randomized trials in order to get an impartial response with not more than five center points (Table 2A, B) and overlay spectra of all the responses are depicted in Figure 4A and 4B. CCD has given optimized spectrophotometric conditions with scanning speed -0.147 nm/sec and sampling interval as -0.259 nm with a desirability nearer to 1 i.e. 0.903. All important parameters evaluated are found to be present within the specified limits. In addition, numerical and graphical optimizations were performed to identify the best option within the given design space. Furthermore, the impact of variables such as scanning speed and sampling interval on response (absorbance) is evaluated. The responses from all trials were fitted in various kinetic models (linear, 2FI, quadratic, cubic) as it showed best fit to the quadratic model. Investigation of ANOVA for the quadratic model showed a p value equal to 0.0053 with R2 value 0.8698, indicating that the model is significant (Table 3). Effect of CMVs on CAA was studied using response, contour, and 3D plots (Figure 5). The graphical optimization was performed by superimposing the contour of the critical response with contour plots using design expert software that led to an overlay plot with two regions (yellow and gray). The overlay plot of the optimized method is represented in Figure 6A. The design space with yellow shade indicates the area with possible response values, whereas gray area indicates the design space with responses that do not meet the criteria. The optimum conditions were selected on the basis of overlay plot and desirability criteria.
Effect of scanning speed and sampling interval on absorbance
The impact of scanning speed and sampling interval on absorbance was studied from 3D plots, 2D contour plots, and polynomial equation (3) (Figure 5). For interpretation and optimization purposes, 3D surface plot and 2D contour plot were used. According to the contours produced under optimal circumstances, investigation should proceed with specified center values for both CMVs. In all three 3D response surfaces for the response, similar pattern was seen for both CMVs. At low levels of a sample interval, curvilinear rise in response was seen with progressive increase in scanning speed. Similarly, with low scanning speeds and increasing sample intervals, small increase in responsiveness was seen. However, at low levels of both CMVs, minimal reaction was seen. The actual vs. predicted plot illustrated that data obtained from the experiments lie within the specified limits Figure 6B. Different colored points in the figure represent the higher R2 values implying that the model can explain most variation. Blue, green, and red points represent the lower, middle, and higher values, respectively. Model appropriateness was suggested by satisfactory p values in ANOVA and low projected residual sum of squares (PRESS) values (Table 3). Polynomial equation of the quadratic model clearly displays that there is a significant positive impact of scanning speed and the sampling interval individually on absorbance. However, there is a negative effect of scanning speed and the sampling interval combinedly on absorbance. The effects of interaction of CMVs, individually and in combination with CAA and desirability of the method due to these interactions are illustrated in Figure 7.
The polynomial equation for the model is as follows:
Absorbance= +1.27 + 0.0170*A + 0.0386*B - 0.0020*AB + 0.0592*A2 + 0.0750*B2 equation (3)
where A is scanning speed and B is sampling interval.
Analytical method validation
Linearity
The obtained linearity chart of XH (Figure 8) was analyzed by its correlation coefficient. The data obtained are represented in Table 4. XH linearity range in methanol was 2-12 µg/mL with a R2 >0.9981.
LOD and LOQ
Sensitivity of the method was assessed by estimating LOD and LOQ. LOD and LOQ for the developed UV method of XH in methanol were found to be 0.77 and 2.36 µg/mL, respectively.
Precision and repeatability
Determination of precision was performed under prescribed conditions by measuring the absorbance multiple times with homogenous sample. The results for both inter- and intra- day are shown in Table 5A and B. Results of the interday and intra-day precision illustrated that the developed method was stable and precise as %RSD values are <2. Repeatability study was performed by taking absorbance of the XH (4 µg/mL) for six times and the percentage drug recovered was calculated by comparing it with the standard graph. %RSD of drug recovered was found to be less than 2.
Accuracy
Accuracy study was conducted using the % recovery method. The results are summarized in Table 6. % Recovery was found to be 99.3%-100.1%. %RSD values were found to be within the acceptable limits (%RSD <2). Therefore, it is concluded that the developed method was accurate.
Specificity
Specificity of the developed method was evaluated using blank SLNs. Percentage drug recovery from blank SLNs mixed with known amount of XH was found to be 99.75 ± 0.23%, which indicated the developed method was specific toward XH. There is no interference with the excipients used in the development of SLNs. Figure 3A-C represents the individual spectrums, which clearly show that there is no peak at the absorption maxima of XH. Therefore, there is no interaction between the excipients used in SLNs with XH.
Analysis of in-house prepared SLNs
The prepared nanoparticles were analyzed for the content of drug encapsulated in the SLNs using equations (1) and (2). Results of %EE and %DL are summarized in Table 7. %RSD <2 is suggesting that the method is efficient for estimation of XH in nanoformulations without any interference.
DISCUSSION
Many UV-spectrophotometric methods have been developed for various drugs for their estimation in bulk and pharmaceutical formulations. In recent years, researchers have also developed UV-spectrophotometric methods for estimation of drugs in nanoformulations, and demonstrated AQbD approach during their developmental process.15,18 This work has been designed based on the past developed methods for estimation of XH in nanoformulations such as SLNs. Till date, there is no UV-visible spectrophotometric method reported for XH using the AQbD approach. All the results of validation parameters lie within the acceptable limits. The method’s specificity and selectivity were accomplished due to the absence of interference from widely used excipients (compritol E ATO, lipoid E80SN, pluronic F-68) in the SLNs. Recovery and accuracy of XH from SLNs were found to be 99.3-100.1% at wavelength 369 nm. LOD and LOQ values were found to be 0.77 and 2.36 µg/mL, respectively. Results of precision studies were found to be %RSD <2, which is an acceptable value. Therefore, the developed method was a reliable and robust method, interference free, which can be used for the estimation of XH in bulk and in nanoformulations.
CONCLUSION
A new robust, simple, and cost-effective UV-visible spectrophotometric method has been developed by using AQbD approach for estimating XH in bulk and nanoformulations. Quality of the analytical method was assured by using AQbD process. The findings point out to the method’s originality, simplicity, accuracy, and precision. Statistical analyses of technique validation results support the established methods suitability for application in quality control laboratories. The developed method is more efficient to estimate XH in nanoformulations without interfering with the excipients used in the formulation. Consequently, this developed method can find its applicability in pharmaceutical industries to estimate XH effectively.
ACNOWLEDGMENTS
Simon H. Stainer, Hopfen GmbH, Mainburg, Germany is highly acknowledged for providing XH. HV sincerely thank to Lipoid GmbH, Germany for providing lipoid E-80 SN. HV is very much thankful to Gattefosse, Mumbai, India for providing Compritol E ATO. The Central Instrumentation Lab, School of Pharmaceutical Sciences, Lovely Professional University is gratefully acknowledged for providing all the necessary facilities for conducting the experiment.
Ethics
Ethics Committee Approval: Not applicable.
Informed Consent: Not applicable.
Peer-review: Externally peer-reviewed.
Authorship Contributions
Concept: H.V., D.T., R.K., P.G., M.G., Design: H.V., S.K.S., D.T., R.K., P.G., M.G., Data Collection or Processing: H.V., D.T., R.K., S.M., Analysis or Interpretation: H.V., D.T., R.K., S.M., Literature Search: H.V., D.T., R.K., Writing: H.V., D.T., R.K.
Conflict of Interest: No conflict of interest was declared by the authors.
Financial Disclosure: The authors declared that this study received no financial support.