
Abstract
Objectives
Herbal weight-loss supplements are widely perceived as safe alternatives to synthetic drugs; however, illegal adulteration with undeclared pharmaceuticals remains a significant public health concern. Sibutramine, withdrawn from the market because of serious cardiovascular risks, is one of the most frequently detected adulterants. This study aimed to develop and validate a sensitive liquid chromatography–tandem mass spectrometry (LC–MS/MS) method to detection of sibutramine in herbal dietary supplements, and to evaluate the presence of sibutramine in commercially available some of the selected products.
Materials and Methods
We analyzed sibutramine by ultra high-performance LC–MS/MS using a triple quadrupole mass spectrometer with electrospray ionization in multiple reaction monitoring (MRM) mode. Identification was based on the protonated precursor ion (m/z 280) and characteristic product-ion transitions. The method was validated for linearity, limits of detection and quantification, recovery, accuracy, precision, robustness, and matrix effects in accordance with internationally accepted bioanalytical validation guidelines.
Results
The method demonstrated excellent linearity over the range of 5–500 µg/L (r = 0.99987), with detection and quantification limits of 0.82 µg/L and 2.73 µg/L, respectively. Validation demonstrated satisfactory accuracy, precision, recovery, robustness, and negligible matrix effects, confirming the method’s suitability for routine analysis. Analysis of 17 commercially available herbal weight-loss supplements revealed the presence of sibutramine in 15 samples (88%), with concentrations ranging from trace levels to substantial amounts, indicating widespread adulteration.
Conclusion
The validated LC–MS/MS method provides a rapid, sensitive, and reliable approach for routine monitoring of sibutramine in herbal dietary supplements. The high prevalence of sibutramine detected in marketed products highlights the persistent problem of illegal adulteration and underscores the need for continuous market surveillance, stricter regulatory enforcement, and routine analytical screening to safeguard public health and ensure product quality.
Keywords: Herbal supplements, sibutramine, adulteration, LC–MS/MS, MRM
INTRODUCTION
The worldwide prevalence of obesity has increased markedly over recent decades, creating a substantial burden on healthcare systems and increasing the incidence of numerous chronic disorders.- As a consequence, consumers have increasingly sought effective and convenient strategies for weight reduction. Alongside prescription medications, consumers increasingly seek botanical products for weight management, as these products are frequently perceived as safer alternatives.- Indeed, a substantial portion of the global population relies on plant-derived products and phytochemicals for the prevention and management of diseases, including obesity.,
Despite their perceived safety, increasing consumption of herbal dietary supplements has raised serious concerns about product quality, authenticity, and actual safety. One of the most critical issues is the intentional adulteration of these products with undeclared synthetic pharmaceuticals to enhance their efficacy., Among these, sibutramine has been identified as one of the most commonly detected adulterants in herbal weight-loss supplements., The addition of such substances poses significant health risks, particularly when consumers are unaware of their presence.
Sibutramine is a centrally acting anti-obesity drug that functions as a serotonin and norepinephrine reuptake inhibitor, leading to appetite suppression and increased thermogenesis.- Sibutramine received regulatory approval for therapeutic use from the U.S. Food and Drug Administration (FDA) in 1997. However, post-marketing clinical evidence demonstrating an increased incidence of major cardiovascular complications, particularly myocardial infarction and stroke, led to its market withdrawal in 2010., The molecular structure of sibutramine is depicted in .
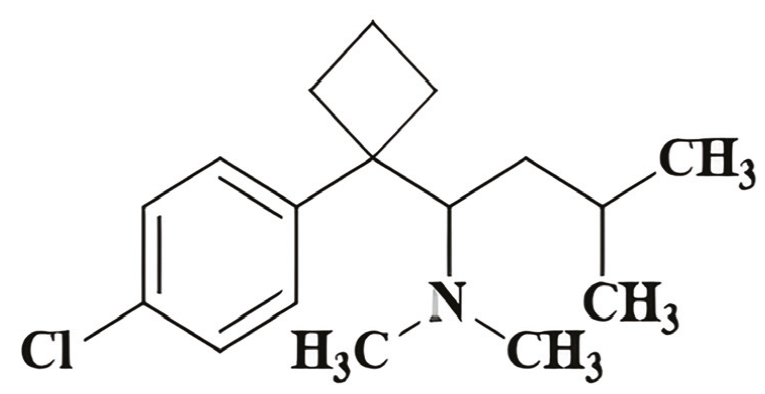
Chemical structure of sibutramine.
Regulatory restrictions have removed sibutramine from approved medicinal use in many countries; nevertheless, it is still encountered as an undeclared constituent of products advertised as natural weight-loss supplements. This practice represents a serious safety issue, as consumers are typically unaware that a pharmacologically active synthetic drug has been incorporated into products marketed as natural. Consequently, users may be unknowingly exposed to sibutramine, which is pharmacologically active and potentially toxic. To identify such adulteration, a range of analytical approaches, including high-performance liquid chromatography (HPLC), high-performance thin-layer chromatography (HPTLC), and various spectroscopic techniques, is employed.-Nevertheless, these methods may show insufficient sensitivity or selectivity when trace quantities of adulterants must be determined in complex herbal matrices. Liquid chromatography–tandem mass spectrometry (LC–MS/MS) offers some of the highest sensitivity and selectivity for confirming pharmaceutical adulterants in complex botanical matrices, due to its superior analytical performance.-
LC–MS/MS methods based on electrospray ionization (ESI) and multiple reaction monitoring (MRM) acquisition identify analytes by monitoring predefined precursor-to-product ion transitions, thereby allowing reliable discrimination of the target compound even in chemically complex extracts.- Furthermore, the identification of specific fragmentation pathways enhances confidence in analyte confirmation and reduces the likelihood of false-positive results. In this context, there remains a critical need for highly sensitive, validated, and reliable analytical methods for the routine monitoring of sibutramine in herbal dietary supplements. Moreover, systematic investigations of commercially available products are essential to evaluate the prevalence of adulteration and to assess potential risks to public health. Accordingly, this work was designed to establish and validate a responsive LC–MS/MS procedure for the determination of sibutramine in herbal weight-loss supplements. The validated method was subsequently applied to a range of commercial products obtained from different marketplaces to assess the occurrence and levels of sibutramine adulteration. By combining advanced analytical techniques with analysis of real-life samples, this study aims to contribute to improvements in quality control, regulatory monitoring, and consumer safety in the rapidly expanding herbal supplement market.
MATERIAL AND METHODS
Samples and standards
Seventeen herbal dietary supplements (Codes 1–17), including herbal teas and food supplements marketed for weight loss, were obtained from various sources, such as e-commerce platforms and herbalists, in March 2023 in Ankara (Türkiye). The products were available in different pharmaceutical forms, including tablets, capsules, powders, tea bags, and soft-gel capsules. Samples were randomly collected from different markets to provide a representative overview of the prevalence of potential sibutramine adulteration in commercially available products (may carry higher risk) within the investigated sample set. To ensure confidentiality, the sources of the products are not disclosed. The pharmaceutical forms and corresponding amounts of dried extract of the analyzed products are presented in . Sibutramine hydrochloride monohydrate (Sigma-Aldrich, USA) was used as the reference standard for qualitative and quantitative analysis.
Table 1. The list of dosage forms of the products used in the analysis.
Product | Pharmaceutical form | Collection channel | Sample mass used for extraction (g) | Total dried extract mass (g) |
|---|---|---|---|---|
Cod 1 | Teabag | e-commerce | 3 | 0.455 |
Cod 2 | Teabag | e-commerce | 9 | 2.180 |
Cod 3 | Effervescent tablet | e-commerce | 20 | 6.862 |
Cod 4 | Capsule | e-commerce | 3 | 0.640 |
Cod 5 | Powder | e-commerce | 4 | 0.452 |
Cod 6 | Teabag | e-commerce | 6 | 1.478 |
Cod 7 | Capsule | e-commerce | 3 | 0.522 |
Cod 8 | Teabag | herbalist | 6 | 1.503 |
Cod 9 | Capsule | e-commerce | 3 | 0.284 |
Cod 10 | Effervescent tablet | e-commerce | 25 | 5.686 |
Cod 11 | Powder | e-commerce | 20 | 5.405 |
Cod 12 | Tablet | e-commerce | 5 | 1.130 |
Cod 13 | Soft gel capsule | e-commerce | 1.5 | 0.319 |
Cod 14 | Powder | e-commerce | 4 | 0.944 |
Cod 15 | Capsule | e-commerce | 5 | 1.689 |
Cod 16 | Tablet | e-commerce | 3 | 1.219 |
Cod 17 | Capsule | e-commerce | 5 | 3.090 |
Extraction and sample preparation
All samples were weighed on a precision balance after opening the original packaging. Solid dosage forms (tablets, effervescent tablets, capsules, and teabags) were finely ground using a mortar and pestle to obtain a homogeneous powder. Each sample was extracted with a mixture of 70% (v/v) methanol (HPLC-grade, Supelco) and distilled water (100 mL), to ensure efficient solubilization of the analyte. Ultrasonic-assisted extraction was performed for 30 min (Julabo USR 3 ultrasonic bath), followed by magnetic stirring for 15 min on a heated magnetic stirrer (Isolab). Following extraction, the samples were filtered, and the solvent was evaporated under controlled conditions. The samples were stored at -80 °C for 48 h and then lyophilized (IlShin Lab. Co., Ltd.) to obtain completely dried extracts (). The lyophilized extracts were stored under appropriate conditions until further analysis.
Preparation of the standard solutions and extracts for LC‒MS analysis
A stock solution of sibutramine (1000 mg/L) was prepared by accurately weighing the required quantity of the reference standard and dissolving it in acetonitrile. Working calibration solutions were generated by serial dilution in acetonitrile to obtain seven concentrations (5, 10, 25, 50, 100, 250, and 500 μg/L). Lyophilized sample extracts were reconstituted in 80% (v/v) acetonitrile–water to a final concentration of 1 mg/mL. Prior to LC–MS/MS analysis, the reconstituted samples were filtered through 0.45 μm membrane syringe filters, dispensed into autosampler vials, and analyzed under optimized chromatographic and spectrometric conditions.
Calculation of sibutramine content in commercial products
An accurately weighed sample of each commercial product, as reported in , was extracted three times with 100 mL of 70% (v/v) methanol. The combined extracts were evaporated and lyophilized, and the total mass of the dried extract was recorded. For LC–MS/MS analysis, each lyophilized extract was reconstituted in 80% (v/v) acetonitrile–water at a final extract concentration of 1 mg/mL (1 g/L). Sibutramine was quantified using the 5–500 µg/L calibration curve, and appropriate dilution factors were applied when necessary.
Because the reconstituted extract concentration was 1 g/L, the sibutramine concentration measured in the LC–MS/MS solution (µg/L) was numerically equivalent to its concentration in the dried extract (µg/g). The sibutramine content of the original commercial product was therefore calculated as follows:
C product (µg/kg) = CLC (µg/L) × DF × (mextract / msample) × 1000
where CLC is the sibutramine concentration determined from the calibration curve, DF is the dilution factor, mextract is the total lyophilized dried-extract mass (g), and msample is the original commercial-product mass subjected to extraction (g).
LC‒MS/MS and chromatographic conditions
Analysis of sibutramine was performed on a Shimadzu Nexera ultra-high-performance liquid chromatography (UHPLC) system coupled to a Shimadzu LC‒MS-8040 triple-quadrupole mass spectrometer. An Agilent Poroshell 120 EC-C18 analytical column (150 × 4.6 mm, 2.7 μm) was employed for chromatographic separation and was operated at a constant temperature of 35 °C. The chromatographic system consisted of an LC-30AD pump, a DGU-20A3R online degassing unit, a column compartment (CTO-10ASvp), and an autosampler (SIL-30AC).
Chromatographic separation was achieved with a reversed-phase LC system employing ultrapure water containing 0.1% (v/v) formic acid (mobile phase A) and acetonitrile supplemented with 0.1% (v/v) formic acid (mobile phase B). Following optimization, the gradient started at 60% B, increased to 90% B after 6 min, remained at 90% B until 11 min, and was subsequently returned to the initial conditions, resulting in a total run time of 15 min. Samples were introduced with a 1 μL injection volume, and the mobile phase was delivered at 0.5 mL/min.
Mass detection was performed under positive ESI using MRM. Sibutramine was identified by the transition from the protonated precursor ion (m/z 280) to fragment ions at m/z 125, 139, and 153. Data acquisition, instrument control, and quantitative processing were accomplished with LabSolutions software (Shimadzu, Kyoto, Japan). The ion source operated at interface, DL, and heat-block temperatures of 350, 250, and 400 °C, respectively. Nitrogen was supplied as the nebulizing gas (3 L/min) and used for sample drying.
Analytical method validation studies
Validation experiments demonstrated that the proposed analytical procedure met internationally accepted performance requirements established in FDA and Eurachem recommendations., Validation was performed using both standard solutions and matrix-matched samples to evaluate the analytical performance of the method under conditions representative of routine analysis of complex herbal matrices. The validation parameters included linearity, limits of detection and quantification (LOD/LOQ), selectivity/specificity, accuracy, precision, matrix effects, extraction recovery, process efficiency, relative expanded uncertainty (U%, k = 2), stability, robustness, and ruggedness (). The experimental design for each validation parameter followed internationally accepted recommendations, ensuring reliable and reproducible analytical performance.
Table 2. Accuracy and precision of the LC–MS/MS method for sibutramine.
Nominal concentration (µg/L) | Intra-day measured concentrations (µg/L) | Mean ± SD (µg/L) | Intra-day RSD (%) | Intra-day accuracy (%) | Inter-day measured concentrations (µg/L) | Mean ± SD (µg/L) | Inter-day RSD (%) | Inter-day accuracy (%) |
5 | 4.84, 4.92, 4.88, 4.91, 4.87, 4.95 | 4.90 ± 0.04 | 0.82 | 98.0 | 4.86, 4.89, 4.91, 4.93, 4.88, 4.90, 4.92, 4.87, 4.91 | 4.90 ± 0.02 | 0.49 | 98.0 |
50 | 49.1, 49.4, 49.6, 49.5, 49.7, 49.3 | 49.43 ± 0.22 | 0.45 | 98.9 | 49.0, 49.3, 49.5, 49.6, 49.4, 49.2, 49.5, 49.7, 49.4 | 49.40 ± 0.23 | 0.47 | 98.8 |
500 | 496.8, 497.9, 498.5, 497.3, 499.0, 498.1 | 497.93 ± 0.79 | 0.16 | 99.6 | 497.1, 497.8, 498.2, 498.6, 497.9, 498.3, 497.5, 498.1, 498.4 | 498.00 ± 0.46 | 0.09 | 99.6 |
LC–MS/MS, liquid chromatography–tandem mass spectrometry; SD, standard deviation; RSD, relative standard deviation.
Table 3. Matrix effect, extraction recovery, and process efficiency of sibutramine in representative herbal supplement matrices evaluated by LC–MS/MS. Two representative sibutramine-free matrices (effervescent tablet, Code 3; powder, Code 11) were evaluated at three concentration levels (5, 50, and 500 μg/L). Matrix effect was calculated from post-extraction spiked matrix samples relative to neat standards; extraction recovery was calculated from pre-extraction spiked samples relative to post-extraction spiked matrix samples; and process efficiency was calculated from pre-extraction spiked samples relative to neat standards.
Matrix | Sample code | Concentration (µg/L) | Neat standard peak areas | Mean neat area | Post-extraction spiked matrix peak areas | Mean matrix area | Pre-extraction spiked matrix peak areas | Mean matrix area | Matrix effect (%) | Extraction recovery (%) | Process efficiency (%) | Interpretation |
|---|---|---|---|---|---|---|---|---|---|---|---|---|
Effervescent tablet | Code 3 | 5 | 441308 | 445175 | 428612 | 430741 | 393105 | 396988 | 96.76 | 92.16 | 89.18 | Slight ion suppression, good extraction recovery, satisfactory total process efficiency |
451318 | 437226 | 401488 | ||||||||||
442899 | 426384 | 396372 | ||||||||||
Effervescent tablet | Code 3 | 50 | 4099058 | 4094988 | 3978642 | 3960277 | 3648550 | 3637023 | 96.71 | 91.84 | 88.82 | Slight ion suppression, consistent extraction recovery, stable overall performance |
4070100 | 3912458 | 3599708 | ||||||||||
4115805 | 3989731 | 3662812 | ||||||||||
Effervescent tablet | Code 3 | 500 | 37664699 | 37699176 | 36184213 | 36198627 | 33271840 | 33447764 | 96.02 | 92.40 | 88.72 | Slight ion suppression, high and stable extraction recovery, reproducible process efficiency |
37795708 | 36428905 | 33650458 | ||||||||||
37637122 | 35982764 | 33420995 | ||||||||||
Powder | Code 11 | 5 | 441308 | 445175 | 432947 | 435767 | 408552 | 411387 | 97.88 | 94.40 | 92.41 | Negligible matrix effect, strong extraction recovery, good total efficiency |
451318 | 442581 | 414728 | ||||||||||
442899 | 431773 | 410881 | ||||||||||
Powder | Code 11 | 50 | 4099058 | 4094988 | 4012887 | 4003355 | 3794122 | 3787429 | 97.76 | 94.61 | 92.49 | Negligible/slight suppression, very good extraction recovery, consistent process efficiency |
4070100 | 3968214 | 3758660 | ||||||||||
4115805 | 4028965 | 3809505 | ||||||||||
Powder | Code 11 | 500 | 37664699 | 37699176 | 36732588 | 36758059 | 34694288 | 34743408 | 97.50 | 94.60 | 92.16 | Negligible/slight suppression, strong extraction recovery good overall performance |
37795708 | 36998471 | 34955170 | ||||||||||
37637122 | 36543119 | 34580766 |
LC–MS/MS, liquid chromatography–tandem mass spectrometry.
Table 4. Relative expanded uncertainty of the LC–MS/MS method.
Nominal concentration (µg/L) | Inter-day RSD (%) | Accuracy (%) | Relative precision uncertainty | Relative bias uncertainty | Combined standard uncertainty | Expanded uncertainty, U (%) |
5 | 0.49 | 98.0 | 0.0049 | 0.0200 | 0.0206 | 4.12 |
50 | 0.47 | 98.8 | 0.0047 | 0.0120 | 0.0129 | 2.58 |
500 | 0.09 | 99.6 | 0.0009 | 0.0040 | 0.0041 | 0.82 |
LC–MS/MS, liquid chromatography–tandem mass spectrometry; RSD, relative standard deviation.
Table 5. Stability of sibutramine under short-term and long-term storage.
Storage condition | Time | Measured concentration (µg/L) | Stability (%) |
|---|---|---|---|
Room temperature (25 °C) | 0 h | 50.40 | 100.00 |
Room temperature (25 °C) | 12 h | 50.16 | 99.52 |
Room temperature (25 °C) | 24 h | 49.88 | 98.97 |
-20 °C | 0 month | 50.40 | 100.00 |
-20 °C | 1 month | 49.92 | 99.05 |
-20 °C | 2 months | 49.51 | 98.23 |
-20 °C | 3 months | 49.03 | 97.28 |
-20 °C | 4 months | 48.62 | 96.47 |
-20 °C | 5 months | 48.14 | 95.52 |
Table 6. Robustness of the LC–MS/MS method.
Parameter varied | Condition | Retention time (min) mean ± SD | Peak area RSD (%) | Measured concentration (µg/L) | Accuracy (%) | Interpretation |
|---|---|---|---|---|---|---|
Nominal conditions | 0.10% FA, 0.50 mL/min | 4.602 ± 0.003 | 0.42 | 49.5 | 99.0 | Reference condition |
Formic acid | 0.09% | 4.624 ± 0.004 | 0.91 | 49.3 | 98.6 | Acceptable |
Formic acid | 0.11% | 4.585 ± 0.003 | 0.84 | 49.6 | 99.2 | Acceptable |
Flow rate | 0.45 mL/min | 4.711 ± 0.005 | 0.68 | 49.4 | 98.8 | Acceptable |
Flow rate | 0.55 mL/min | 4.536 ± 0.004 | 0.64 | 49.7 | 99.4 | Acceptable |
LC–MS/MS, liquid chromatography–tandem mass spectrometry; RSD, relative standard deviation; SD, standard deviation.
Table 7. Ruggedness of the LC–MS/MS method.
Analyst | Measured concentrations (µg/L) | Mean ± SD (µg/L) | RSD (%) | Accuracy (%) | Retention time (min), mean ± SD |
Analyst 1 | 49.5, 49.6, 49.4, 49.7, 49.5, 49.6 | 49.55 ± 0.10 | 0.20 | 99.1 | 4.604 ± 0.003 |
Analyst 2 | 49.3, 49.5, 49.4, 49.6, 49.5, 49.4 | 49.45 ± 0.10 | 0.20 | 98.9 | 4.607 ± 0.004 |
LC–MS/MS, liquid chromatography–tandem mass spectrometry; RSD, relative standard deviation; SD, standard deviation.
Table 8. Sibutramine content in the analyzed commercial products determined by LC–MS/MS.
Samples | Sibutramine | Sibutramine content (µg/kg) |
|---|---|---|
Code 1 | + | 75.84 ± 1.59 |
Code 2 | + | 1866.98 ± 39.21 |
Code 3 | - | ND (peak) |
Code 4 | + | 128763.94 ± 2704.04 |
Code 5 | + | 40.15 ± 0.84 |
Code 6 | + | 13.31 ± 0.28 |
Code 7 | + | 18969.25 ± 398.35 |
Code 8 | + | 5132.52 ± 107.78 |
Code 9 | + | 212975.62 ± 4472.49 |
Code 10 | + | 91.57 ± 1.92 |
Code 11 | - | ND (peak) |
Code 12 | + | 7.03 ± 0.15 |
Code 13 | + | 23427.10 ± 491.97 |
Code 14 | + | 0.59 ± 0.012 |
Code 15 | + | 2.84 ± 0.059 |
Code 16 | + | 3.02 ± 0.063 |
Code 17 | + | 34.75 ± 0.73 |
Values are expressed as sibutramine concentration ± expanded measurement uncertainty (µg/kg; k = 2). Absolute expanded uncertainties were obtained by multiplying each concentration by the corresponding relative expanded uncertainty expressed as a fraction. ND, not detected; LC–MS/MS, liquid chromatography–tandem mass spectrometry.
Statistical analysis
This study comprised analytical method development and validation followed by a laboratory-based, cross-sectional survey of 17 commercially available herbal weight-loss supplements purchased in Ankara, Türkiye, in March 2023. The products included tablets, capsules, powders, tea bags, and soft-gel capsules obtained from e-commerce platforms and herbalists. The study involved direct analysis of purchased products rather than retrospective analysis of existing records or prospective follow-up of participants. No intervention groups or randomized treatment allocation were involved. Each commercial product constituted a separate sampling unit; replicate analytical measurements were used to assess method performance and were not considered additional independent product samples. Data were evaluated using descriptive statistics, including arithmetic means, standard deviations (SDs), relative SDs (RSDs), frequencies, and percentages, as appropriate. RSD was calculated as (SD/mean) × 100. Calibration was performed using linear regression of chromatographic peak area against sibutramine concentration at seven levels (5, 10, 25, 50, 100, 250, and 500 µg/L), each analyzed in triplicate. The regression equation and coefficient of determination (r2) were used to describe the calibration relationship. Accuracy and precision were evaluated at 5, 50, and 500 µg/L. Intra-day precision was assessed using six independent determinations at each concentration, whereas inter-day precision was assessed over three consecutive days, with three determinations per concentration per day (nine determinations per concentration). Accuracy was expressed as the mean measured concentration divided by the nominal concentration, multiplied by 100.
Matrix effects, extraction recovery, and process efficiency were evaluated at three concentration levels in two sibutramine-free matrices using triplicate responses for neat standards, post-extraction spiked samples, and pre-extraction spiked samples. These parameters were calculated from the corresponding mean peak-area ratios and expressed as percentages. Stability was expressed as the percentage of the initial measured concentration remaining at each assessment time. Robustness and ruggedness were evaluated descriptively using retention times, measured concentrations, accuracy, and RSD; ruggedness testing comprised six replicate analyses by each of two analysts. Relative expanded measurement uncertainty was estimated by combining the relative precision and bias contributions in quadrature and applying a coverage factor of k = 2. Relative expanded uncertainty was expressed as U (%) = 2 × u_rel × 100, where u_rel represents the combined relative standard uncertainty. For the commercial-product results presented in , this relative uncertainty was expressed in absolute concentration units using U_abs = C × U (%)/100, where C is the reported sibutramine concentration. Results were therefore reported as C ± U_abs (µg/kg). The ± values represent expanded measurement uncertainty, not SD or standard error. Instrument data acquisition and quantitative processing were performed using LabSolutions software (Shimadzu, Kyoto, Japan). The frequency of sibutramine detection was calculated as the number of positive products divided by the total number of products analyzed, multiplied by 100. This percentage describes the investigated sample set and was not used to estimate market-wide adulteration prevalence. No inferential hypothesis tests were performed; consequently, no statistical significance threshold was specified.
Ethics approval and informed consent
Ethics committee approval and informed consent were not required, as it did not involve human participants or experimental animals in this study.
RESULTS
LC‒MS/MS analytical method validation studies
A more rapid, highly sensitive, and robust LC method was developed and comprehensively optimized for the quantitative determination of sibutramine in herbal dietary supplements. Method verification was performed in accordance with the U.S. FDA Bioanalytical Method Validation Guidelines and the Eurachem/CITAC Guide to ensure compliance with internationally accepted analytical performance criteria., Standard solutions, matrix-matched spiked samples, and non-spiked samples were analyzed to evaluate method performance under conditions representative of routine laboratory analysis. The validation results presented in –6 demonstrate that the developed method meets the required analytical criteria and is suitable for reliable quantification of sibutramine in complex herbal matrices. Representative LC‒MS/MS TIC chromatograms that demonstrates the sibutramine content of standard sibutramine, herbal dietary supplements, and selectivity study samples are shown in Supplementary Figures S1–S19.
Linearity
The linearity of the LC method was evaluated using an external calibration curve constructed from seven concentration levels of sibutramine (5–500 μg/L), each analyzed in triplicate. The calibration range was established to include the anticipated concentrations of sibutramine in adulterated herbal dietary supplements. Linear regression analysis produced a coefficient of determination, r2 = 0.99987, demonstrating that detector response was directly proportional to analyte concentration across the validated range. The calibration curve was described by the regression equation y = 74961.2x + 213882, confirming the linearity of the analytical signal across the working range (). In addition, the reproducible retention time of sibutramine (Rt ≈ 4.6 min) and the consistency of peak responses further demonstrate the reliability of the chromatographic system. A high correlation coefficient and a consistent response across all concentration levels indicate that the method provides reliable quantitative performance for the determination of sibutramine in herbal supplement matrices.
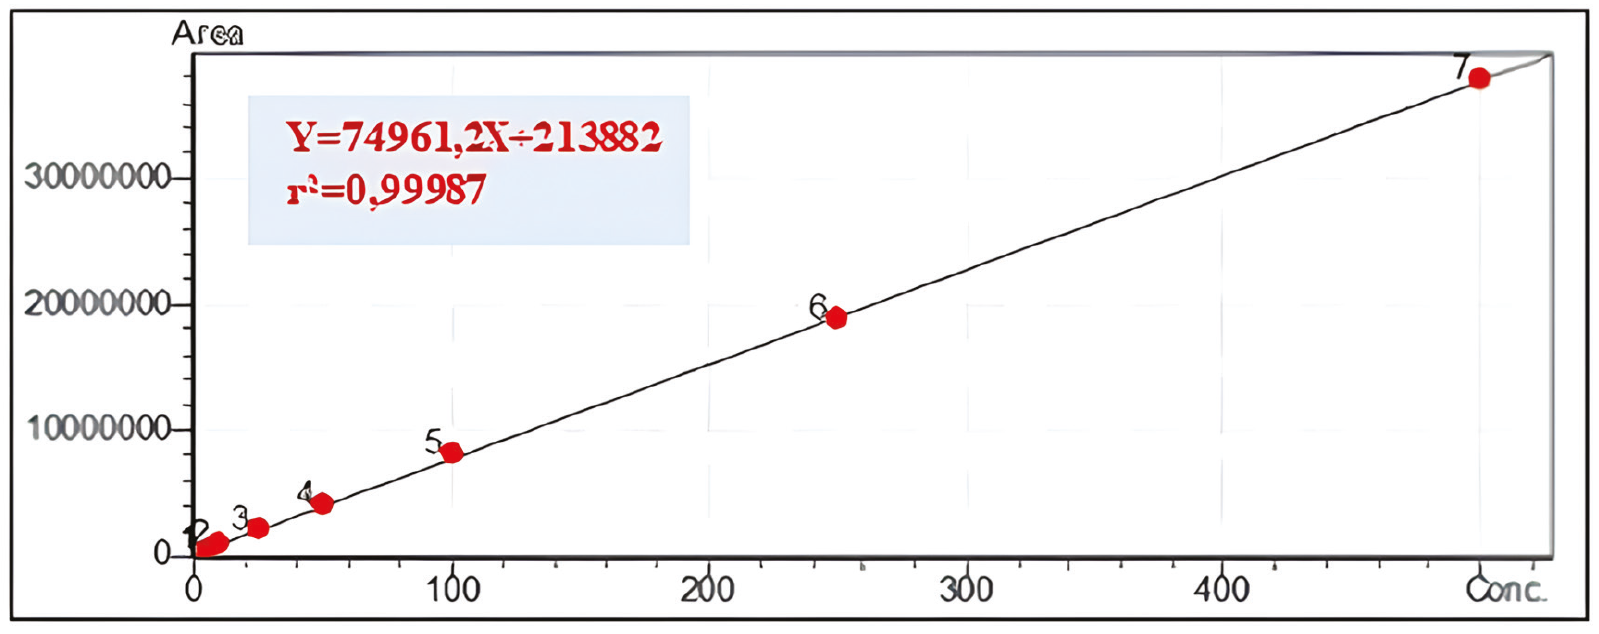
The calibration curve of sibutramine used as a standard sample.
LOQ/LOD
The LOD and LOQ were determined by statistical analysis of signals obtained from multiple blank matrix samples. The SD of the blank responses was used to estimate the sensitivity of the method. The following equations were applied:
LOD = mean blank + 3 × SD
LOQ = mean blank + 10 × SD
The calculated LOD and LOQ values were 0.82 μg/L and 2.73 μg/L, respectively, indicating the high sensitivity of the developed method. These low detection limits demonstrate that the method can detect and quantify trace levels of sibutramine in complex herbal matrices. The obtained LOD and LOQ values are well below the lowest calibration level, demonstrating that the method is capable of accurately quantifying sibutramine at trace concentrations across the validated analytical range.
Selectivity/specificity
The selectivity of the developed method was evaluated using representative herbal matrices, which were confirmed to be free of sibutramine, including an effervescent tablet (Code 3) and a powder formulation (Code 11). These matrices were selected as blank samples because no peak was observed at sibutramine retention time (Rt ≈ 4.6 min) during initial screening. Blank matrix extracts were analyzed under the optimized LC–MS/MS conditions. In addition, the same matrices were spiked with sibutramine at the minimum calibration level (5 μg/L) to verify the detectability of the analyte in the presence of matrix components. For comparison, real positive samples (Code 10 for effervescent tablets and Code 5 for powder) were also analyzed. As shown in Supplementary Figure S19, no interfering peaks observed at Rt ≈ 4.6 min in any of the blank matrix chromatograms. The retention time of sibutramine, together with the absence of interfering peaks across different matrices, confirms the method’s suitability for analysis of complex herbal products. In contrast, spiked matrices and real positive samples exhibited well-defined peaks at the expected Rt. These findings demonstrate that the developed method is highly selective for sibutramine and is not affected by endogenous components of complex herbal matrices.
Accuracy and precision (RSD)
Method performance was investigated using a matrix-matched standard addition approach, assessing accuracy and precision at three concentration levels (5, 50, and 500 μg/L), covering the lower, intermediate, and upper portions of the calibration interval. Repeatability was assessed by six independent determinations performed on the same day, whereas intermediate precision was evaluated using measurements performed over three successive days, with three replicates analyzed each day. Accuracy was assessed by comparing the experimentally determined concentrations with the corresponding fortified concentrations and expressing the results as percentage recovery. As summarized in , both intra-day and inter-day accuracies ranged from 98.0% to 99.6% across all concentration levels. The RSD values for intra-day precision were between 0.16% and 0.82%, whereas inter-day RSD values ranged from 0.09% to 0.49%. These results demonstrate that the method has excellent repeatability and intermediate precision, with all RSD values well below commonly accepted limits for quantitative LC–MS/MS analysis. The slightly higher variability observed at the lowest concentration level is consistent with typical analytical behavior at trace levels. Overall, the method exhibits high precision and accuracy across the entire calibration range, confirming its suitability for quantitative determination of sibutramine in complex herbal matrices.
Matrix effects
Matrix effects were evaluated in two representative sibutramine-free herbal matrices selected during the selectivity study: an effervescent tablet matrix (Code 3) and a powder matrix (Code 11). Blank matrix extracts were prepared according to the proposed sample preparation procedure and were spiked post-extraction with sibutramine at three concentration levels covering the calibration range (5, 50, and 500 μg/L). Responses from post-extraction spiked matrix samples were compared with those from neat standard solutions prepared at the same concentrations (). The matrix effect was calculated using the following equation:
Matrix effect (%) = (peak area of post-extraction spiked matrix / peak area of neat standard) × 100
Values close to 100% indicate negligible matrix effect, whereas values below and above 100% indicate ion suppression and ion enhancement, respectively. In the effervescent tablet matrix (Code 3), the matrix effect values were determined to be 96.76%, 96.71%, and 96.02% at 5, 50, and 500 μg/L, respectively. These results indicate slight but consistent ion suppression across all concentration levels. In the powder matrix (Code 11), the corresponding matrix effect values were 97.88%, 97.76%, and 97.50%, indicating only minimal signal suppression and values close to ideal response conditions. Overall, the matrices examined remained within a narrow range (96.02–97.88%) and showed limited variation across the tested concentrations. demonstrates the matrix effect of sibutramine in herbal supplement matrices evaluated by LC–MS/MS. These findings demonstrate that matrix-induced ion suppression was minor and well controlled under the optimized LC–MS/MS conditions. The results confirm that the developed method is not significantly affected by matrix components and is suitable for the reliable determination of sibutramine in complex herbal supplement matrices.
Extraction recovery and process efficiency
To clearly distinguish the contributions of matrix effects and sample preparation efficiency, extraction recovery and process efficiency were assessed in two representative sibutramine-free herbal matrices: an effervescent tablet matrix (Code 3) and a powder matrix (Code 11). The evaluation was performed at three concentration levels (5, 50, and 500 μg/L) using three sets of samples: (i) neat standard solutions, (ii) post-extraction spiked blank matrix extracts, and (iii) pre-extraction spiked matrix samples subjected to the complete extraction procedure (). Matrix effect (%) was calculated as the ratio of the peak area obtained from post-extraction spiked matrix samples to that of neat standard solutions at the same concentration, according to the following equation:
Matrix effect (%) = (peak area of post-extraction spiked matrix / peak area of neat standard) × 100
Extraction recovery (%) was determined from the chromatographic responses of samples before extraction relative to those after extraction; the related to equations were given below:
• Extraction recovery (%) = (peak area of pre-extraction spiked matrix / peak area of post-extraction spiked matrix) × 100
• Process efficiency (PE, %) was calculated as the ratio of the peak area of pre-extraction spiked samples to that of neat standard solutions:
• Process efficiency (%) = (peak area of pre-extraction spiked matrix / peak area of neat standard) × 100
This approach enables the independent evaluation of ionization-related matrix effects and extraction-related analyte loss, while process efficiency reflects the combined influence of both factors.
In the effervescent tablet matrix (Code 3), matrix effect values ranged from 96.02% to 96.76% across the three concentration levels, indicating consistent but slight ion suppression. Extraction recoveries ranged from 91.84% to 92.40%, demonstrating that the extraction procedure provided reproducible and satisfactory recovery of sibutramine from this matrix. The corresponding process efficiency values ranged from 88.72% to 89.18%, reflecting the combined influence of minor ion suppression and moderate extraction losses. These results indicate that the analytical performance remains stable across the tested concentration range, with limited variation across the tested concentrations. In the powder matrix (Code 11), matrix-effect values ranged from 97.50% to 97.88%, indicating negligible to very slight ion suppression and confirming minimal impact of matrix components on ionization efficiency. Extraction recovery values were higher than those observed for the effervescent tablet matrix, ranging from 94.40% to 94.61%, suggesting more efficient analyte extraction from the powder matrix. Process efficiency values ranged from 92.16% to 92.49%, demonstrating good overall analytical performance with limited signal loss throughout the procedure. Overall, the results obtained for both matrices show that matrix effects were minor and well controlled, while extraction recovery was consistently high and reproducible. The process-efficiency values remained within an acceptable range across all concentration levels and matrix types, indicating that the analytical workflow established in this study enabled the reliable identification. Furthermore, the absence of significant concentration-dependent trends in any of the evaluated parameters confirms the stability and suitability of the method for routine analytical applications.
Relative expanded uncertainty
The relative expanded uncertainty of the developed method was estimated in accordance with the Eurachem/CITAC approach, considering contributions from intermediate precision and systematic bias. The combined standard uncertainty (u_rel) was calculated by combining relative precision uncertainty and relative bias uncertainty using this equation:
u_rel = √(u_precision2 + u_bias2)
The value of expanded uncertainty was derived from the combined standard uncertainty using a coverage factor (k = 2), corresponding to approximately 95% confidence.
U (%) = 2 × u_rel × 100
As shown in , the expanded uncertainties were 4.12%, 2.58%, and 0.82% at 5, 50, and 500 μg/L, respectively.
The highest uncertainty was observed at the lowest concentration level, which is expected due to increased relative variability near the limit of quantification. The decreasing trend in uncertainty with increasing concentration reflects improved analytical precision and reduced influence of systematic error at higher analyte levels. Overall, the uncertainty values obtained in this study are within acceptable limits for quantitative LC–MS/MS analysis and demonstrate the reliability of the method for routine applications.
Stability
The storage stability of sibutramine was investigated using a quality control sample containing 50 μg/L under both ambient (short-term) and frozen (-20 °C, long-term) conditions. Stability was commentated by comparing the concentration measured at each sampling time (Ct) with the initial concentration (C0), and the results were reported as percentage stability according to the following equation:
Stability (%) = (Ct / C0) × 100
As presented in , sibutramine remained stable under short-term conditions, with stability values of 99.52% and 98.97% after 12 and 24 hours, respectively. The long-term stability evaluation revealed a gradual decrease in analyte concentration over time, with stability values ranging from 99.05% after one month to 95.52% after five months when stored at -20 °C. Despite this slight decline, the analyte remained within acceptable stability limits throughout the study period. These findings indicate that sibutramine is sufficiently stable under typical laboratory handling and storage conditions, supporting the reliability of the analytical method for routine use.
Robustness
Robustness of the LC method was assessed by introducing small, deliberate variations to critical parameters, including formic acid concentration (0.09–0.11%) and the mobile phase flow rate (0.45–0.55 mL/min). The impact of these variations on retention time, peak area precision, and quantitative results was assessed using replicate analyses. As shown in , slight shifts in retention time were observed with changes in both parameters, consistent with expected chromatographic behavior. However, the peak area RSD values remained below 1%, and accuracy values ranged from 98.6% to 99.4%, indicating that the quantitative performance of the method was not significantly affected. These results indicate that the method is robust and maintains reliable analytical performance despite minor variations in chromatographic conditions, provided that parameters remain within controlled limits.
Ruggedness
Ruggedness was evaluated by comparing the analytical performance of two independent analysts under identical experimental conditions, using a 50 μg/L sibutramine standard solution. Each analyst performed six replicate analyses. As summarized in , both analysts produced comparable results, with mean concentrations of 49.55 μg/L and 49.45 μg/L, RSD values of 0.20% for both analysts, and accuracy values of 99.1% and 98.9%, respectively. Retention times were also consistent, with minimal variation between analysts. The similar results between analysts confirms that the method is rugged and reproducible, demonstrating its reliability across different operators and supporting its suitability for routine laboratory applications.
Quantification of sibutramine in real-life samples by the validated LC–MS/MS method
The validated LC–MS/MS conditions were applied to the analysis of 17 herbal supplements marketed for weight loss. Sibutramine was detected in 15 out of 17 samples, corresponding to a detection frequency of approximately 88%, indicating a widespread occurrence of adulteration in the investigated products. No detectable levels were observed in samples Code 3 and Code 11, confirming their suitability as blank matrices during method validation. The quantified sibutramine concentrations varied over a remarkably wide range, from 0.59 µg/kg (Code 14) to 212,975.62 µg/kg (Code 9) (), and the related TIC chromatograms are provided as Supplementary Figures S1–S19. This substantial variability suggests a lack of standardization and the uncontrolled addition of the synthetic drug across different products. Particularly high concentrations on a product basis were observed in Codes 4, 7, 9, and 13, indicating marked variability in the extent of sibutramine adulteration among the investigated products. However, these concentrations represent the amount of sibutramine per unit mass of product and should not be interpreted as an ingested dose without information on serving size and product consumption.
DISCUSSION
The detection of undeclared sibutramine in products marketed as herbal or natural represents an important consumer safety concern, particularly because sibutramine was withdrawn from therapeutic use owing to cardiovascular safety concerns. Nevertheless, the concentrations reported in represent analytical concentrations in the product (µg/kg), rather than doses consumed by users. Because reliable information on serving size and recommended daily intake was not available for all investigated products, no direct comparison with historical therapeutic doses was made. The analytical performance of the method was supported by the characteristic mass spectral behavior of sibutramine. The ESI mass spectrum revealed a dominant protonated precursor ion at m/z 280, together with several fragment ions, confirming the identity of the analyte and providing a reliable molecular fingerprint for compound identification.
As shown in , the experimental mass spectral data clearly demonstrate the characteristic precursor and product ions used for identification and quantification. The observed fragmentation pattern is consistent with previously reported data for sibutramine,- verifying the reliability of the selected transitions for analysis. The proposed fragmentation pathway further supports the selection of the monitored product ions. In particular, the formation of the fragment ions at m/z 153, 139, and 125 can be explained by stepwise cleavage of the protonated molecular ion, as previously described in the literature.,
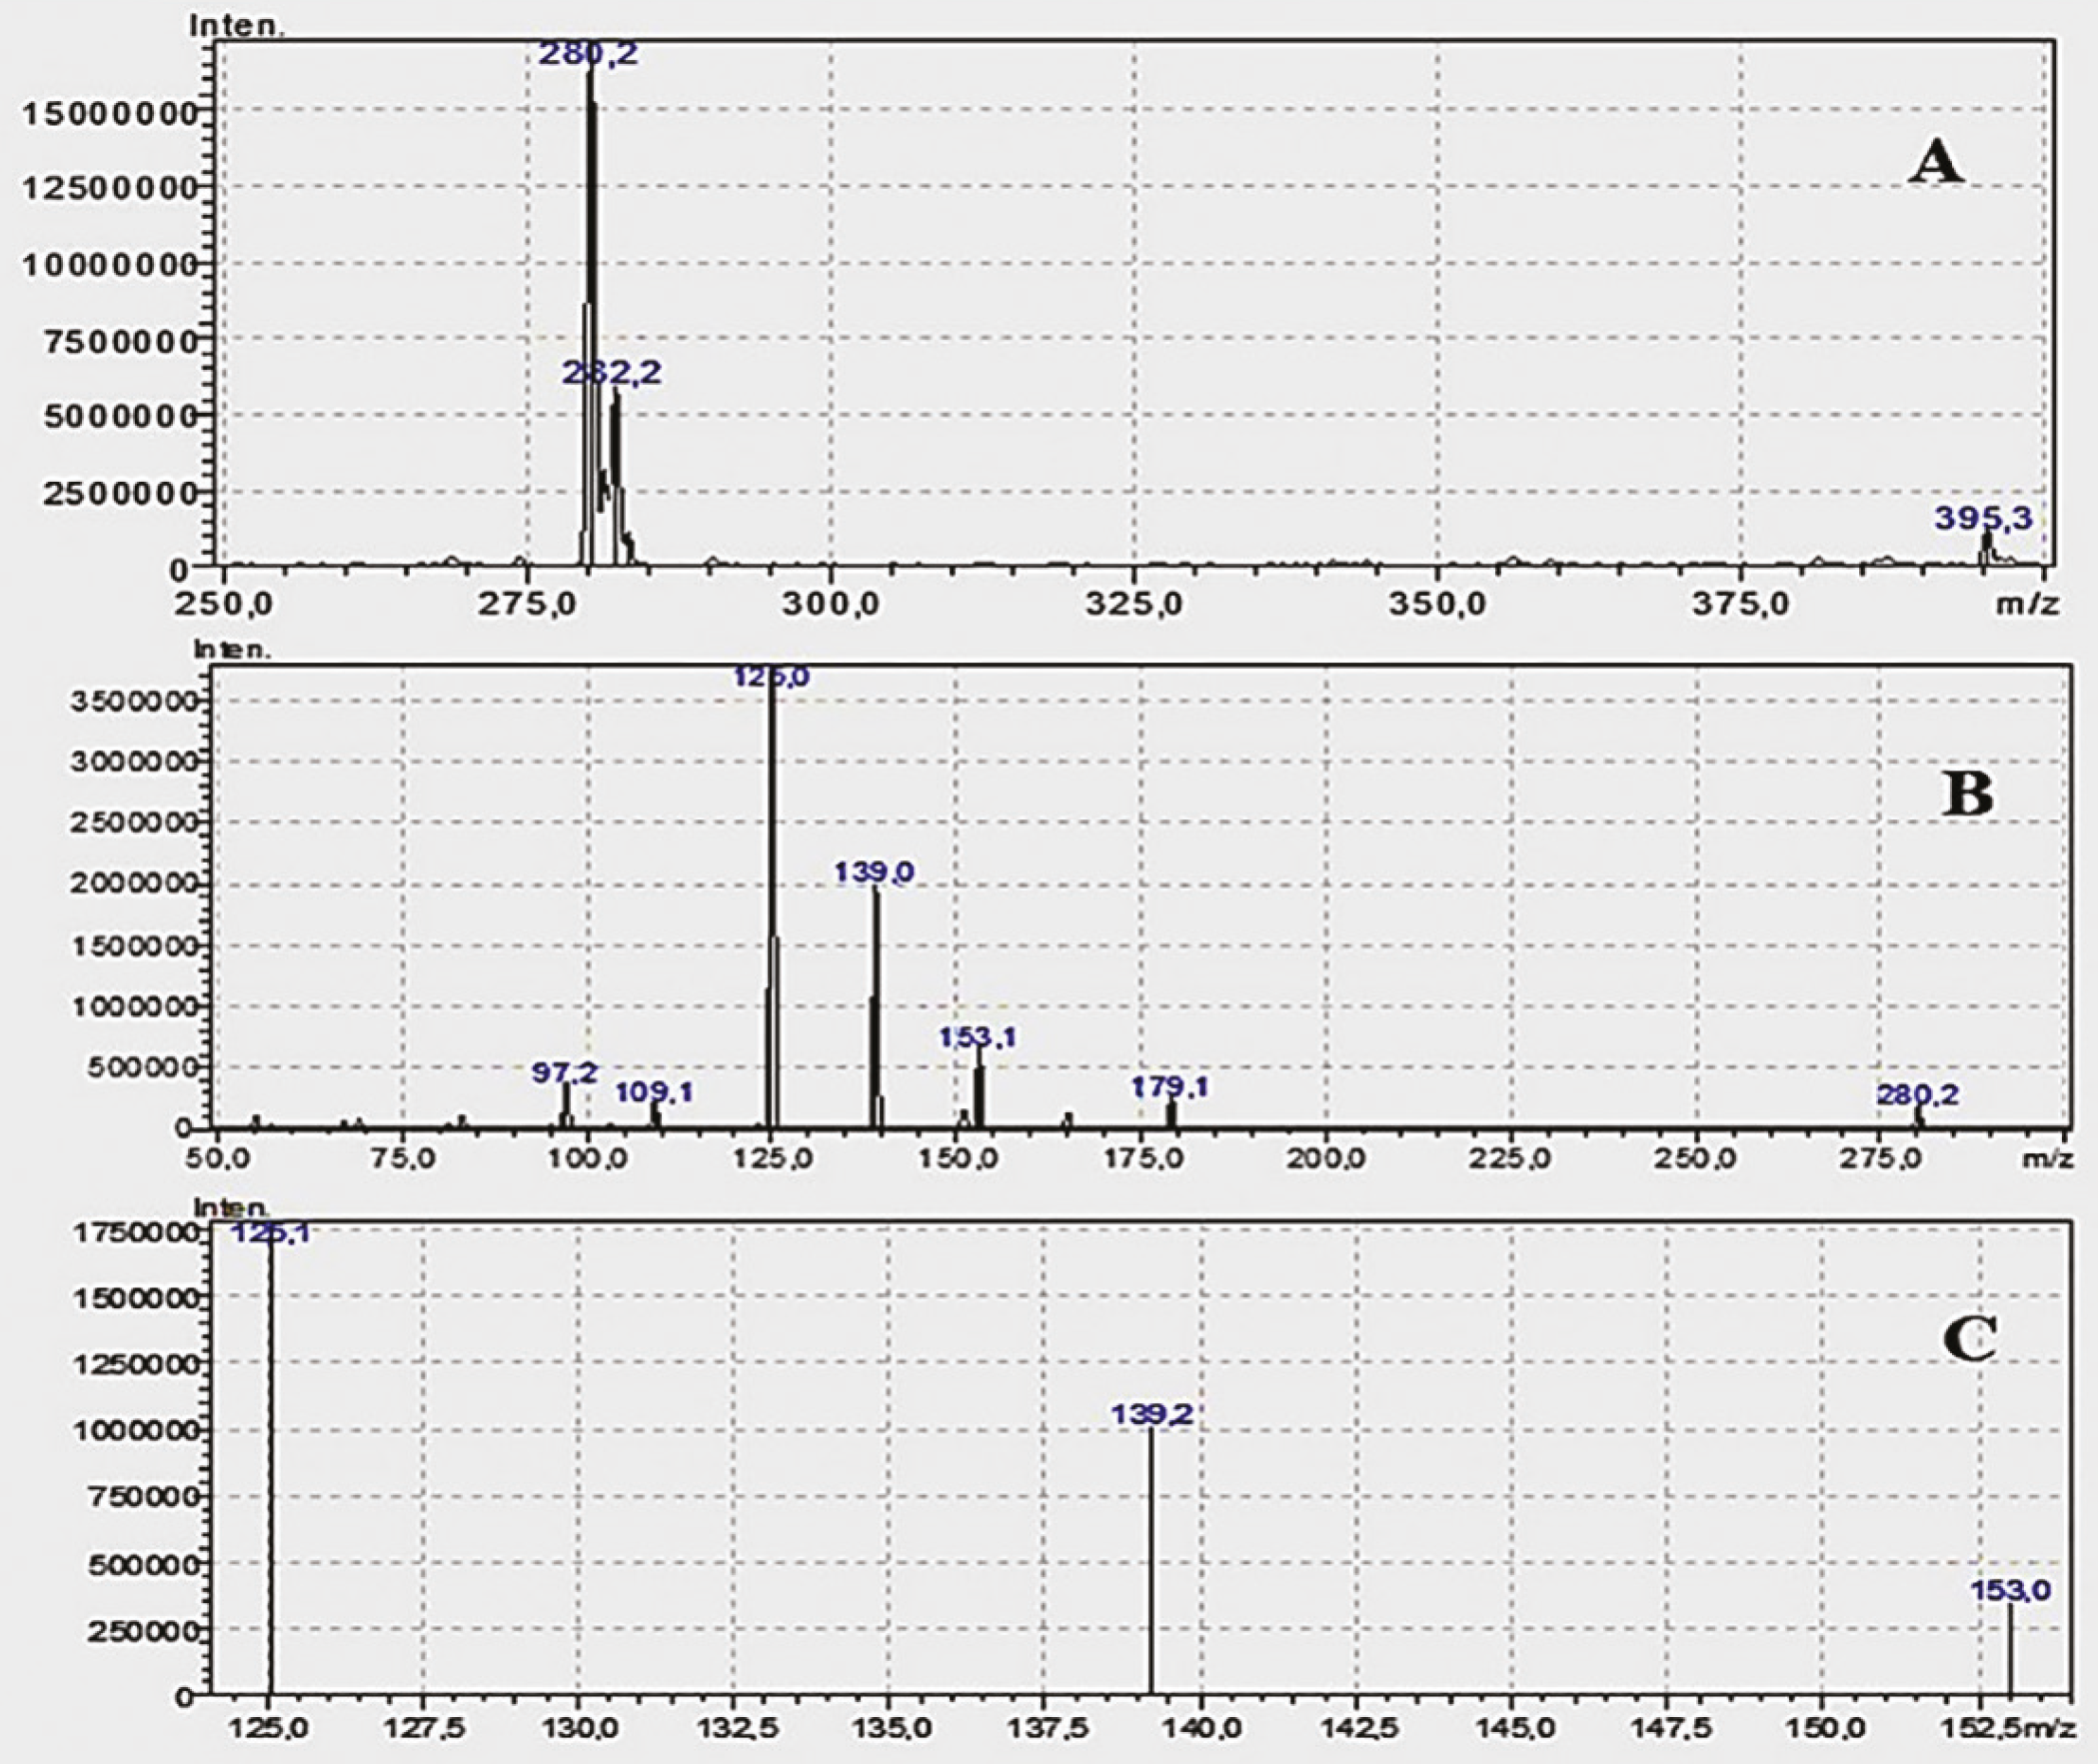
The molecular mass scanning spectrum of sibutramine.
(A) The positive molecular mass scanning spectrum of sibutramine (m/z: 250–400). (B) Mass scan spectrum of the positive degradation product of sibutramine (m/z 50–300). (C) Multiple reaction monitoring ion mass spectrum of sibutramine.
The fragmentation behavior of sibutramine demonstrates the structural basis for the selected MRM transitions. The consistency between experimental and theoretical fragmentation patterns provides additional confidence in the specificity of the developed method. Quantitative analysis was performed in MRM mode using the precursor ion at m/z 280 and its characteristic product ions at m/z 125, 139, and 153. This approach enabled highly selective and sensitive detection of sibutramine in complex herbal matrices. The calibration curve () exhibited excellent linearity (r2 = 0.99987), confirming the suitability of the method for accurate quantification over a wide concentration range. The high prevalence of sibutramine detected in this study (88%) is considerably greater than that reported in previous investigations. For example, sibutramine was identified in approximately 20% of herbal supplements in a UHPLC-MS/MS study, while other studies reported detection rates of 15.3% and 25.7%. The markedly higher occurrence observed in the present study may reflect differences in sampling strategies, product sources, or increasing trends in adulteration practices.
Various analytical techniques, including LC–MS/MS, HPLC-DAD, and HPTLC, have been employed for the detection of sibutramine and other adulterants in herbal supplements.,,- While these methods provide useful screening capabilities, LC–MS/MS, particularly in MRM mode, offers superior sensitivity and selectivity for confirmatory analysis, especially in complex matrices., In agreement with previous LC–MS/MS studies,, the developed method demonstrated excellent analytical performance, enabling reliable detection of sibutramine even at trace levels. Furthermore, the use of characteristic fragmentation pathways enhances confidence in compound identification, decreasing the risk of false-positive results. The widespread detection of sibutramine in the analyzed samples highlights the persistent issue of adulteration in herbal weight-loss products. In previous studies, similar concerns have been reported, with sibutramine and other synthetic drugs were detected in dietary supplements marketed as natural products., Overall, the findings of this study demonstrate that sibutramine adulteration remains a serious and ongoing issue in the herbal supplement market. The developed LC–MS/MS method provided a powerful and reliable analytical tool for routine monitoring and regulatory control, enabling the rapid detection of illegal adulterants and contributing to improved consumer safety.
Study limitations
The present study has some limitations. First, the relatively small number of dietary supplement samples analyzed limits the generalizability of the findings to all dietary supplements available on the market. Therefore, the results should be interpreted solely within the scope of the samples examined in this study. Further investigations involving larger sample sizes and a wider range of brands, products, and sales channels would contribute to a more comprehensive assessment of the prevalence of sibutramine adulteration in dietary supplements. Nevertheless, the present study provides valuable findings by identifying the presence of sibutramine in the investigated products and highlighting the importance of quality control and post-market surveillance of dietary supplements.
CONCLUSION
The growing popularity of herbal weight-loss products brings with several concerns. Many people seek easier, faster weight-loss solutions and turn to dietary supplements believed to aid weight loss with less effort. Ensuring that herbal medicines are effective and safe requires proper regulation and quality control measures. A significant issue is the adulteration of these products, which poses risks to human health and safety. For example, sibutramine, an adulterant found in some herbal slimming products, has been linked to health problems in numerous cases. Various analytical methods have been developed to detect and prevent inclusion of this contaminant in herbal weight-loss products.
In the present study, a reliable procedure for the quantification of sibutramine in herbal weight-loss supplements was developed and comprehensively validated. The analytical characteristics met internationally recognized performance requirements, demonstrating adequate selectivity, linearity, precision, accuracy, sensitivity, and robustness. Examination of products specifically selected from e-commerce platforms generally considered unsafe showed that undeclared sibutramine was present in 88% of the analyzed samples, indicating adulteration of products marketed as herbal weight-loss supplements. The detected concentrations showed extreme variability, ranging from trace levels to exceptionally high amounts. These findings strongly suggest the possibility of intentional and uncontrolled adulteration. The presence of sibutramine in products marketed as “natural” or “herbal” is of particular concern, given its withdrawal from the market due to serious cardiovascular risks. The consumption of such adulterated products may expose consumers to significant health hazards, especially in the absence of proper labeling and dosage control. The results of this study, especially when considering the selected products, highlight critical gaps in the regulation, quality control, and surveillance of herbal dietary supplements, particularly those sold via online platforms and informal markets. The high incidence of adulteration observed emphasizes the urgent need for stricter regulatory oversight and routine screening of such products. However, the proposed approach offers an efficient platform for the accurate determination of sibutramine in complex herbal formulations. Its analytical performance supports routine laboratory testing, regulatory monitoring, and post-market monitoring of herbal dietary supplements. This study underscores the importance of continuous monitoring of herbal supplements to ensure consumer safety and supports the implementation of more stringent control strategies to prevent the distribution of adulterated products. However, this study reported the prevalence in the investigated samples rather than providing an estimate of the prevalence of sibutramine adulteration in the broader marketplaces.
Ethics
Ethics Committee Approval: Ethics committee approval was not required, as it did not involve human participants or experimental animals in this study.
Informed Consent: Informed consent was not required, as it did not involve human participants or experimental animals in this study.
Footnotes
Authorship Contributions
Concept: S.Y., A.O., Data Collection or Processing: S.Y., A.O., M.A.Y., Literature Search: S.Y., A.O., M.A.Y., Analysis or Interpretation: A.O., M.A.Y.
Conflict of Interest
The authors declare no conflicts of interest.
Financial Disclosure
The authors declared that this study received no financial support.
References
Wang YC, McPherson K, Marsh T, Gortmaker SL, Brown M. Health and economic burden of the projected obesity trends in the USA and the UK. Lancet. 2011;378:815-825. Erratum in: Lancet. 2011;378:1778.
Sharma T, Kanwar SS. Phytomolecules for obesity and body weight management. J Biochem Cell Biol. 2018;1:1-8.
Borah AK, Sharma P, Singh A, Kalita KJ, Saha S, Chandra Borah J. Adipose and non-adipose perspectives of plant derived natural compounds for mitigation of obesity. J Ethnopharmacol. 2021;280:114410.
Mathon C, Ankli A, Reich E, Bieri S, Christen P. Screening and determination of sibutramine in adulterated herbal slimming supplements by HPTLC-UV densitometry. Food Addit Contam Part A Chem Anal Control Expo Risk Assess. 2014;31:15-20.
Mir SA, Shah MA, Ganai SA, Ahmad T, Gani M. Understanding the role of active components from plant sources in obesity management. J Saudi Soc Agric Sci. 2019;18:168-176.
Firozian F, Nili-Ahmadabadi A, Moradkhani S, Moulaei M, Fasihi Z, Ahmadimoghaddam D. Adulteration of the herbal weight loss products by the illegal addition of synthetic antiobesity medications: a pilot study. J Obes. 2021;2021:9968730.
Mohamed GA, Ibrahim SR, Elkhayat ES, El Dine RS. Natural anti-obesity agents. Bull Fac Pharm Cairo Univ. 2014;52:269-284.
Kumar V, Singh DD, Lakhawat SS, Yasmeen N, Pandey A, Singla RK. Biogenic phytochemicals modulating obesity: from molecular mechanism to preventive and therapeutic approaches. Evid Based Complement Alternat Med. 2022;2022:6852276.
De Carvalho LM, Cohen PA, Silva CV, Moreira AP, Falcão TM, Dal Molin TR, Zemolin G, Martini M. A new approach to determining pharmacologic adulteration of herbal weight loss products. Food Addit Contam Part A Chem Anal Control Expo Risk Assess. 2012;29:1661-1667.
Posadzki P, Watson L, Ernst E. Contamination and adulteration of herbal medicinal products (HMPs): an overview of systematic reviews. Eur J Clin Pharmacol. 2013;69:295-307.
Muschietti L, Redko F, Ulloa J. Adulterants in selected dietary supplements and their detection methods. Drug Test Anal. 2020;12:861-886.
Kozhuharov VR, Ivanov K, Ivanova S. Dietary supplements as source of unintentional doping. Biomed Res Int. 2022;2022:8387271.
Hsu YW, Chu DC, Ku PW, Liou TH, Chou P. Pharmacotherapy for obesity: Past, present and future. J Exp Clin Med. 2010;2:118-123.
Bae JW, Choi CI, Jang CG, Lee SY. Simultaneous determination of sibutramine and its active metabolites in human plasma by LC-MS/MS and its application to a pharmacokinetic study. Biomed Chromatogr. 2011;25:1181-1188.
Fanelli D, Weller G, Liu H. New serotonin-norepinephrine reuptake inhibitors and their anesthetic and analgesic considerations. Neurol Int. 2021;13:497-509.
Yen M, Ewald MB. Toxicity of weight loss agents. J Med Toxicol. 2012;8:145-152.
Jeong D, Priefer R. Anti-obesity weight loss medications: short-term and long-term use. Life Sci. 2022;306:120825.
Çebi N, Yılmaz MT, Sağdıç O. A rapid ATR-FTIR spectroscopic method for detection of sibutramine adulteration in tea and coffee based on hierarchical cluster and principal component analyses. Food Chem. 2017;229:517-526.
Ariburnu E, Uludag MF, Yalcinkaya H, Yesilada E. Comparative determination of sibutramine as an adulterant in natural slimming products by HPLC and HPTLC densitometry. J Pharm Biomed Anal. 2012;64-65:77-81.
Haneef J, Shaharyar M, Husain A, Rashid M, Mishra R, Siddique NA, Pal M. Analytical methods for the detection of undeclared synthetic drugs in traditional herbal medicines as adulterants. Drug Test Anal. 2013;5:607-613.
Zhivikj Z, Karapandzova M, Brezovska K, Ivanovska TP, Karanfilova IC, Stefkov G, Petrushevska-Tozi L, Kulevanova S. Validation of HPLC-DAD method for analysis of sibutramine, fluoxetine, caffeine, theobromine and phenolphthalein as potential adulterants in weight loss dietary supplements. Maced Pharm Bull. 2020;66(Suppl 2):33-34.
Chen Y, Zhao L, Lu F, Yu Y, Chai Y, Wu Y. Determination of synthetic drugs used to adulterate botanical dietary supplements using QTRAP LC-MS/MS. Food Addit Contam Part A Chem Anal Control Expo Risk Assess. 2009;26:595-603.
Kim SH, Lee J, Yoon T, Choi J, Choi D, Kim D, Kwon SW. Simultaneous determination of anti-diabetes/anti-obesity drugs by LC/PDA, and targeted analysis of sibutramine analog in dietary supplements by LC/MS/MS. Biomed Chromatogr. 2009;23:1259-1265.
Ma J, Pawar RS, Grundel E. Validation of an LC-MS/MS method for analysis of anti-diabetic drugs in botanical dietary supplements labeled for blood sugar management. Drug Test Anal. 2018;10:609-617.
Zhang L, Feng R, He R, Liang Q. Detection and verification of sibutramine adulterated in herbal slimming supplements using electrospray ionization mass spectrometry: detection of sibutramine in herbal supplement. Bull Korean Chem Soc. 2018;39:411-590.
Zeng Y, Xu Y, Kee CL, Low MY, Ge X. Analysis of 40 weight loss compounds adulterated in health supplements by liquid chromatography quadrupole linear ion trap mass spectrometry. Drug Test Anal. 2016;8:351-356. Erratum in: Drug Test Anal. 2017;9:334.
Ponnuru VS, Challa BR, Nadendla R. Quantification of sibutramine and its two metabolites in human plasma by LC-ESI-MS/MS and its application in a bioequivalence study. J Pharm Anal. 2012;2:249-257.
Yun J, Shin KJ, Choi J, Jo CH. Isolation and structural characterization of a novel sibutramine analogue, chlorosipentramine, in a slimming dietary supplement, by using HPLC-PDA, LC-Q-TOF/MS, FT-IR, and NMR. Forensic Sci Int. 2018;286:199-207.
Ellison SLR, Williams A, eds. Eurachem/CITAC guide: Quantifying Uncertainty in Analytical Measurement. 3rd ed. 2012.
FDA. Guidance for Industry: Bioanalytical Method Validation. US Food and Drug Administration, Center for Drug Evaluation and Research; 2013.
Huang Z, Xiao S, Luo D, Chen B, Yao S. Simultaneous determination of sibutramine and N-Di-desmethylsibutramine in dietary supplements for weight control by HPLC-ESI-MS. J Chromatogr Sci. 2008;46:707-711.
Petkova-Gueorguieva E, Ivanov K, Gueorguiev S, Mihaylova A, Madzharov V, Ivanova S. Detection of sibutramine in herbal food supplements by UHPLC/HRMS and UHPLC/MS-MS. Biomed Res. 2018;29:3006-3009.
Jairoun AA, Al-Hemyari SS, Shahwan M, Zyoud SH. Adulteration of weight loss supplements by the illegal addition of synthetic pharmaceuticals. Molecules. 2021;26:6903.
Kim HJ, Lee JH, Park HJ, Cho SH, Cho S, Kim WS. Monitoring of 29 weight loss compounds in foods and dietary supplements by LC-MS/MS. Food Addit Contam Part A Chem Anal Control Expo Risk Assess. 2014;31:777-783.
Zhong Y, Sun C, Xiong J, Shi Y. Simultaneous determination of eight adulterants in weight management supplements and herbs by HPLC-DAD and LC-MS/MS. J Liq Chromatogr Relat Technol. 2017;40:640-648.
Zaharieva Z, Foteva T, Karadjova V, Danalev D. Determination of some prohibited substances in food supplements using HPLC with MS or UV detection – view on current development. J Chem Technol Metall. 2021;56:1141-1155.
Zaharieva Z, Tanev D, Danalev D. Development and validation of HPLC/DAD method for simultaneously determination of six prohibited substances in model matrices. Acta Chromatogr. 2020;32:276-280.
Supplementary Materials
Supplementary Figures
Download